Bulletin of the Atomic Scientists · 2026

The Doomsday Clock

The official setting is a symbolic assessment of global risks, not a live countdown. Explore the historical decisions below to see when the Clock moved and the reasons the Bulletin gave.

Global Threat Watch LATEST DEVELOPMENTS
LOADINGChecking the latest global risk headlines…
Live news feed connectingView all news ↓
Current official published setting
85
SECONDS TO MIDNIGHT
Announced 27 January 2026
● Official setting, fixed until updated

The number remains at 85 until the Bulletin announces a new setting. It does not mean a catastrophe is predicted to happen in 85 seconds.

Read the official 2026 statement ↗
Global Threat Watch

Latest global risk news

A developing news feed covering nuclear risk, conflict, climate, health, technology and critical infrastructure. Headlines link to their original publishers.

Connecting to global news sources…

This feed is for awareness, not prediction. Breaking reports can change as facts are confirmed. We distinguish reported events from warnings and forecasts; always read the linked source and follow official advice.

How the Clock has changed

Choose a year to explore the setting, what was happening at the time, and why the Bulletin judged the risks to be changing. This is a selection of key milestones, not every adjustment.

On a phone, swipe the timeline sideways. Select any year to open its details.

2026
85 seconds
Closest ever

Historical setting

The closest setting in the Clock’s history.

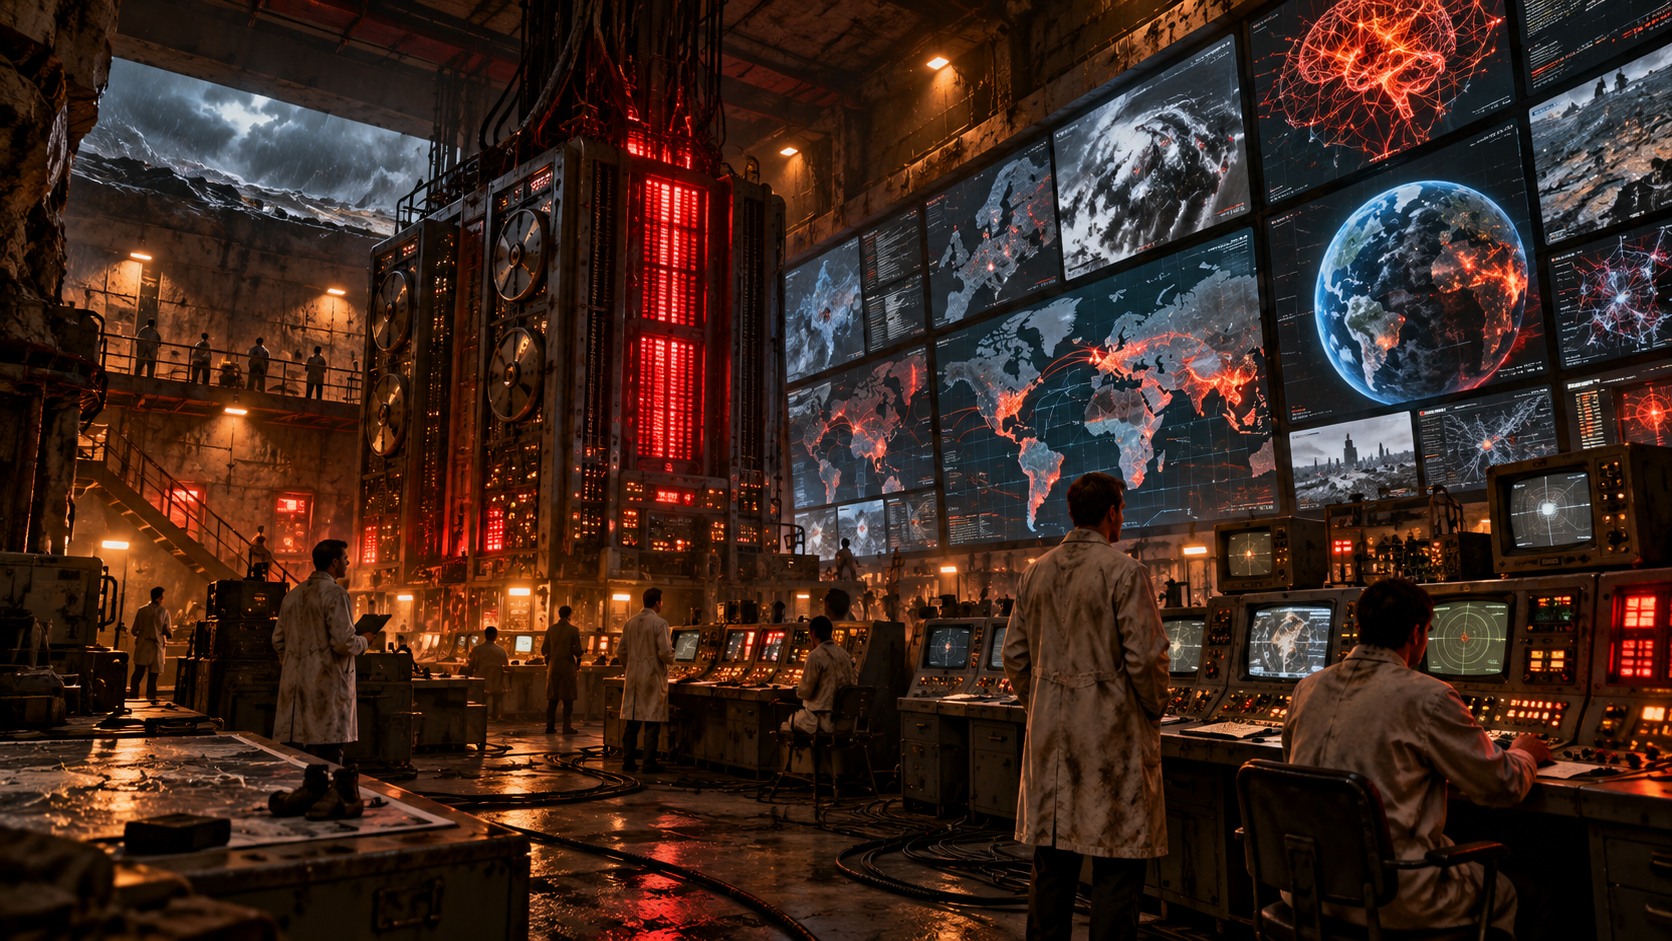
Researchers monitor an AI and global-risk command centre in a decaying underground bunker

85 seconds to midnight

What happened?

The Bulletin cited increasingly aggressive competition between major powers and weakening international cooperation.

Why did it matter?

Global risks are interconnected; less cooperation makes nuclear, climate, biological and technological dangers harder to manage.

Read the Bulletin's statement ↗
Source and accuracy: Our summaries explain the main points in plain English. Each year has its own original editorial illustration. The Bulletin remains the primary source for its official decision, while our guide adds context in plain English. DoomsdayClock.info is an independent guide, not an official Bulletin website.
Practical preparedness

Ready for 3 days. Building towards 2 weeks.

You do not need a bunker or expensive survival gear. Start with ordinary things that help during a power cut, water outage, severe weather or a disruption to shops and transport. Use what you already own, then build up gradually.

This is everyday emergency planning, not a prediction that disaster is imminent. Follow official instructions during an actual emergency.

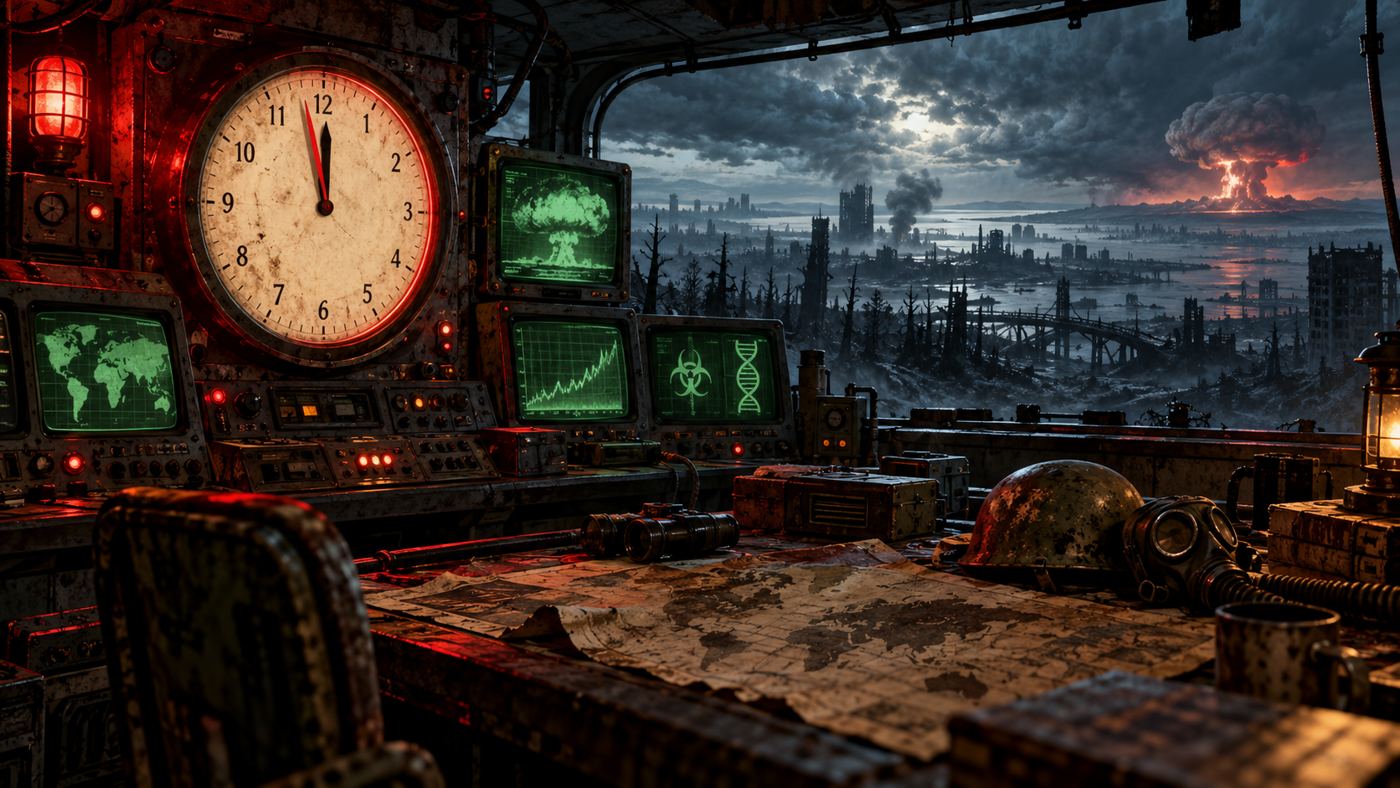
Retro-futuristic emergency control room overlooking a damaged landscape
01

Your first 72 hours

Focus on the basics: drinking water, food, light, warmth, medication and a way to receive updates.

💧

Water first

A useful starting target is 3 litres per person per day for drinking, so 9 litres per person for three days. You may need more for cooking, washing, babies, medical needs and pets.

  • Store sealed bottled water somewhere cool and out of direct sunlight.
  • Keep some water accessible if you can; do not rely on taps working.
  • Use safe, commercially bottled water where possible and follow local water-safety advice.
🥫

Food that works without power

Choose familiar food that keeps and needs little or no cooking.

  • Tinned meals, beans, fruit, fish or vegetables, with a manual tin opener.
  • Crackers, cereal, nuts, dried fruit, long lasting snacks and UHT milk if suitable.
  • Include food for babies, special diets and pets. Rotate supplies into normal meals.
🔦

Light, warmth and charging

  • Torch or hand crank light, with spare batteries. Torches are safer than candles.
  • Charged power bank and charging cables; keep phones on low power mode.
  • Warm layers, blankets and sleeping bags, especially in a cold home.
  • Battery or hand crank radio for updates if the internet or mobile network fails.
🩹

Health and hygiene

  • Essential medication and medical supplies. Request repeat prescriptions in good time.
  • Basic first aid kit, hand sanitiser, wet wipes, toilet paper and rubbish bags.
  • Baby supplies, nappies, ready to feed formula if used, and pet food.
  • Write down important medical details and instructions for any equipment you rely on.
📻

Information and family plan

  • Write important phone numbers on paper, including an contact outside your area.
  • Agree a family meeting point and how you will check in if phones fail.
  • Keep copies of key documents in a waterproof folder or secure digital backup.
  • Keep a little cash if possible in case card payments or cash machines are unavailable.
🏠

Know your home

  • Know how to safely shut off water, gas and electricity if needed.
  • Check smoke alarms and keep exits clear.
  • Ask your utility providers about priority support if someone relies on powered medical equipment or may need extra help.
  • Never use a barbecue or outdoor camping stove indoors; carbon monoxide can kill.
Start small: check your cupboards before buying anything. If money is tight, add one useful item when you can. Your normal food and bills come first.
Beyond the first 14 days
Field manual in development

The Survival Guide

A practical, illustrated field guide to becoming more self-reliant when essential services are disrupted. Not just a list of things to buy: clear explanations, realistic plans, diagrams and skills you can build over time.

⚡ Power & energySolar basics, batteries, backup power and realistic off-grid options.
🌱 Food supplyGrowing food, seed planning, preservation and long-term storage.
💧 WaterCollection, safe storage, treatment limits and reliable replenishment.
🏚 Shelter & warmthInsulation, weatherproofing, safe heating and keeping a home habitable.
🩹 Health & hygieneFirst-aid planning, sanitation, medication and household needs.
🧭 Skills & communityPractical skills, communication, planning and helping each other.

Be first to know when it is ready

Join the newsletter for launch updates, previews and new preparedness guides.

The guide will focus on lawful, practical resilience and safety. Recommendations will be checked against reliable sources, with specialist and community experience clearly distinguished from verified guidance.

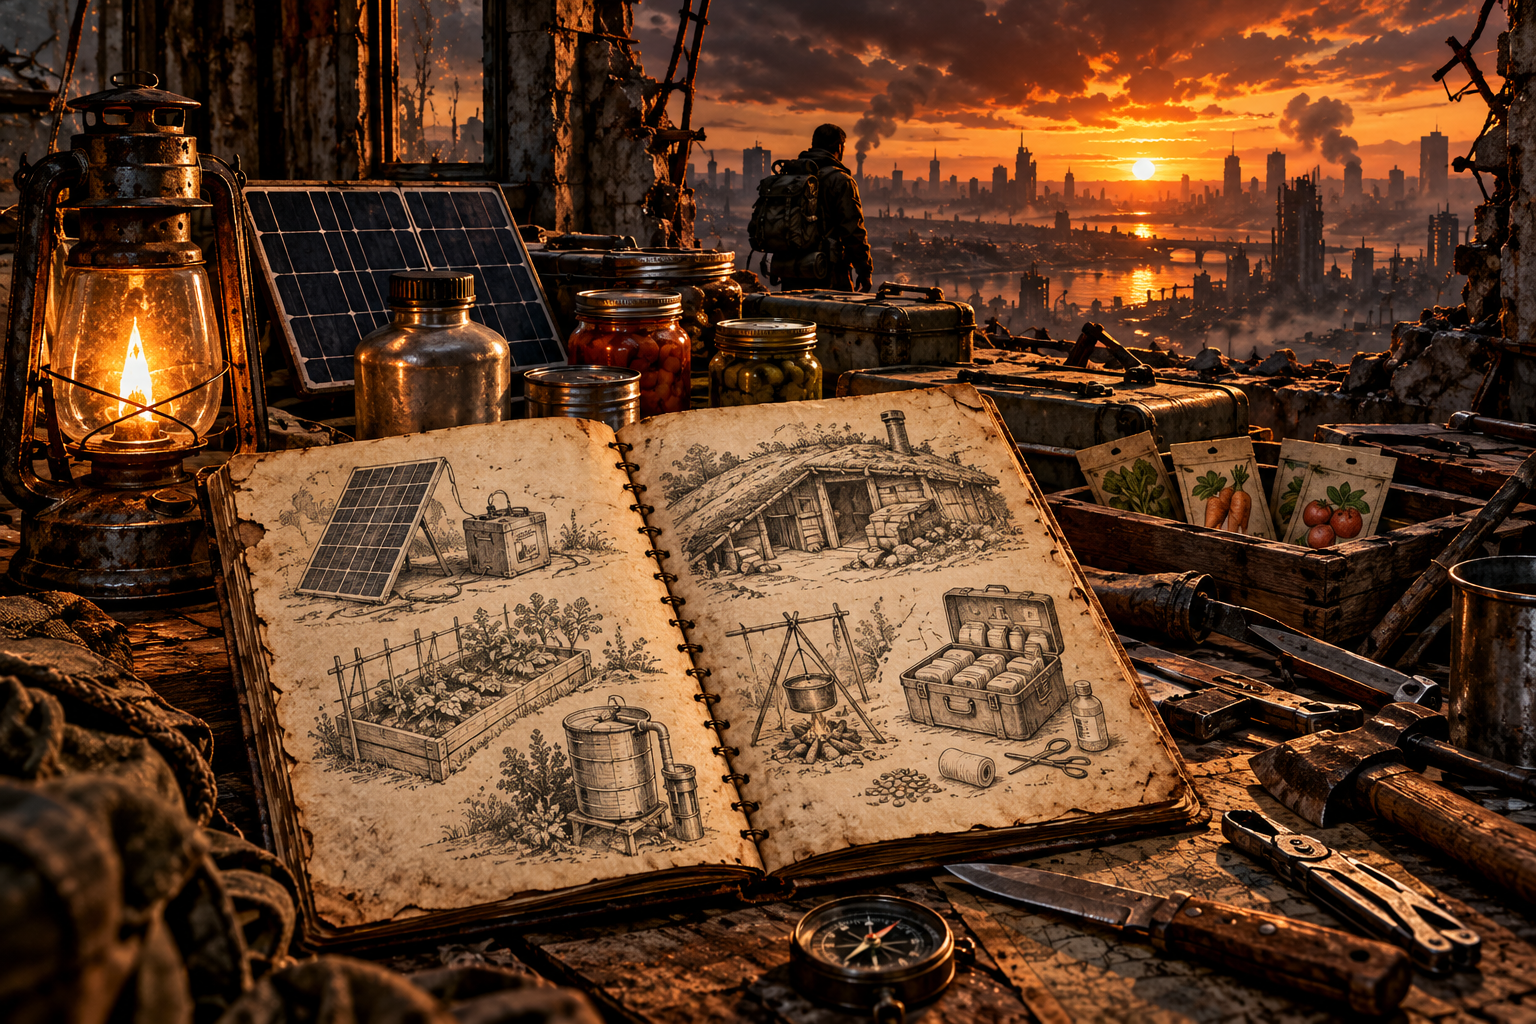
Cinematic preview artwork for a survival field manual, showing illustrated notes on food, water, power and shelter beside a post-apocalyptic landscape
Understand risk by place

Country & City Risk Atlas

There is no single, reliable score that tells you how dangerous a country or city is for every kind of crisis. A place can face high flood exposure but have strong defences, or face conflict nearby while having strong emergency services. This atlas separates the main risk types so you can understand what the evidence does, and does not, say.

First, a crucial distinction

Hazard is what could happen, such as a flood, earthquake, heatwave or armed conflict. Exposure is the people and infrastructure in harm's way. Vulnerability is how badly they could be affected. Response capacity is how well people and services can prepare, respond and recover.

Risk depends on all of these. This page is an orientation guide, not a live warning, a precise city-level prediction, a nuclear target map or a ranking of places likely to be attacked.

How to use this atlas

  1. Choose a risk theme below. Each theme means something different and should not be compared as if it were one universal score.
  2. Check the place and scale. Country-level indices can hide major differences between regions, neighbourhoods and even streets.
  3. Open the original data. Use the linked specialist sources to check the latest edition, date, method and limitations.
  4. Turn information into preparation. Local alerts, flood maps, civil-protection advice and realistic household planning are more useful than speculative rankings.
⚔️Conflict & security

Armed conflict and regional spillover

What to examine: active fighting, displacement, border proximity, disruption to transport and essential services.

Conflict risk is highly time-sensitive and can change rapidly. National peace indices help compare broad conditions, but they are not a forecast of where violence will happen and do not describe every city equally. A country average may conceal areas facing very different circumstances.

Useful for: understanding broad security context. For travel or immediate safety decisions, check current official travel advice, local authorities and trusted humanitarian updates.

🌋Natural hazards

Earthquakes, storms, floods and other hazards

Illustrative examples: the Philippines faces multiple hazard types; flood risk also varies greatly within river basins and coastal regions.

Natural-hazard risk is not just how often a hazard occurs. It also depends on how many people and buildings are exposed, building quality, infrastructure, poverty, early warnings and the capacity to respond. The WorldRiskIndex combines exposure with societal vulnerability, but its country-level result should not be treated as a neighbourhood forecast.

Useful for: comparing broad national disaster-risk patterns, then checking local hazard maps and emergency plans for the specific address or area.

🌡️Climate exposure & resilience

Heat, drought, water stress and sea-level rise

Illustrative examples: low-lying coastal areas can face flood exposure; hot and dry regions can face water stress. Risks vary within countries.

Climate risk depends on the physical hazard, who and what is exposed, and the ability to adapt. ND-GAIN compares country vulnerability and readiness across food, water, health, ecosystems, human habitat and infrastructure. It is a climate-adaptation index, not a general safety score and not a prediction for a specific city.

Useful for: understanding long-term climate vulnerability and adaptation capacity. For a property or neighbourhood, use local flood, heat and water-risk information where available.

🧬Health & outbreaks

Outbreaks and pressure on health services

What to examine: disease surveillance, access to healthcare, vaccination, water and sanitation, population movement and health-system capacity.

International travel hubs may be important for disease surveillance because many people move through them, but that does not mean an outbreak will begin in a particular city. Country-level epidemic and humanitarian risk assessments can highlight structural pressures, while public-health agencies provide current alerts and guidance.

Useful for: following verified public-health updates, keeping routine vaccinations current and planning continuity for essential medicines.

⚡Infrastructure & essential services

Power, water, communications and transport

Applies to every country; local dependencies matter more than a single global ranking.

Storms, floods, technical failures, cyber incidents or conflict can disrupt services. The effects depend on backup systems, repair capacity, network design and how dependent households are on electricity, mobile networks, water pumps or digital payments. Public global indices do not reliably tell you which individual street will lose service.

Useful for: identify local outage-alert services, understand which services your household depends on, keep essential contacts offline and build a modest emergency supply.

🧭Putting the evidence together

Country profile versus city-level reality

Start with a country indicator, then narrow down to the region, city, neighbourhood and site.

INFORM Risk compares the risk of humanitarian crises and disasters that could overwhelm a country's response capacity, using hazards and exposure, vulnerability and lack of coping capacity. The WorldRiskIndex focuses on natural hazards and societal vulnerability. The Global Peace Index measures peacefulness, conflict and militarisation. ND-GAIN focuses on climate vulnerability and readiness. These tools answer different questions and should not be merged into one homemade “danger score”.

Best practice: compare like with like, check publication dates, read the method, and treat missing or low-resolution data as uncertainty rather than proof that a place is safe.

What this atlas does not do

  • It does not assign made-up scores or rank cities by likelihood of being attacked.
  • It does not claim that a city is a nuclear target or predict where a future disaster will strike.
  • It does not treat country averages as precise local forecasts.
  • It does not combine incompatible indices into one score without a transparent, validated method.

For people planning where they live or travel: check the relevant local hazard maps, current travel advice, emergency alerts and health guidance. This page explains broad patterns; it cannot replace local information.

Method note: the descriptions above summarise the purpose and limitations of the linked tools. The atlas does not currently calculate live scores. Always consult the linked source for its latest edition and date.
What does the Clock mean?

The Bulletin of the Atomic Scientists created the Doomsday Clock in 1947. Its Science and Security Board sets the time after assessing risks such as nuclear weapons, climate change, biological threats and disruptive technologies. It is a warning symbol, not a forecasting tool.

View the complete official timeline ↗ · Read the official FAQ ↗